 Research and data. These are two of the main underpinnings of a good online strategy. Information about how data spreads across the Internet is always helpful, and today we are going to take a look at one way to get that data: Google Ripples.
What Is It?
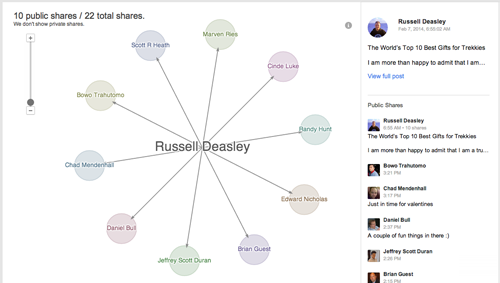
Google+ Ripples is a nifty and interactive way to visually display who has shared a specific post on Google+. It is baked in as part of the Google+ network as a free service, although if you plan to work with it, prepare for it to be time-consuming.
Basics
To look at the Ripples for any public post, click the dropdown arrow at the top of the post and look for the “View Ripples” option.
You can also look at Ripples data for a specific URL, a handy option for webmasters. Just open the Ripples dialog box, and look in the top corner. Enter the URL you want to see Ripples for and you’ll get a visualization for all the Google+ public shares it has received.
You can also share a Ripples visualization, perhaps with your online team. It’s really easy to do: Just grab the URL while you are viewing it and share that with whomever you wish.
What you can’t see
Ripples is an interesting tool, but it doesn’t show you everything. Google tells you on its page about Ripples exactly what you can and cannot see in their interactive representation. They even put it above the fold and in colorful red text:
While Ripples displays a lot of cool information, you’re not actually seeing all the action that’s taken place. For instance, Ripples only uses public data, so there may be a discrepancy between the number of shares that you see on a post in the stream and the number of shares that Ripples displays.
This means that anything that has been shared to an individual circle or a nonpublic community will not show up. What it does show is all the public interactions that have been indexed by the Big G.
Social Metrics
While viewing a Ripple look at the right side of the page and you will find a list of people who have reshared the post, as well as the content they’ve added to it. Move your cursor around the graph to view post previews. Under the graph, you will also find other tools, including a playable time-lapse view of the Ripple’s progression. In addition, the bottom section of a Ripples page includes information on reshares over time, shares by Influencers, statistics including average chain length of shares, and the languages used in the shared posts.
The visual layout of Ripples is wonderful for client presentations and reports — just make sure the person on the receiving end understands that this is only using publicly available data.
Identify Influencers
You can view a list of influencers (users who have many public reshares of the post) right under the time-lapse bar. This is where strategy comes in.
Take a look at the influencer’s Google+ page and get a feel for what sort of content he or she is sharing. Take a good look at the Ripples for some of the posts to find the original source of the post. If that person seems approachable you have just identified a subject for outreach.
If you can get this person to reshare your content there is a hope that the influencer you are trying to reach will see it, and it will have an additional layer of trust since it is coming from a source that person already shares content from.
Additionally you can attempt to reach out and build a relationship with the influencer directly. Let your best judgement be your guide in which path you take.
Reporting
At the moment Ripples is the option if you want measurement on Google+. There really is very little else. Much like the rather limited Facebook Insights, it provides only a small amount of data, but it is still could be enough to fill a previously blank area in your reporting. It’s about as close to an actual performance report as we have right now. Some of the data you can bring to your clients includes:
- How many posts have been created
- Improvements in +1’s
- Increase or decrease in followers
- How many comments have been made
- Ripple graphics to provide visualizations of engagement
Studying Ripples can give a brand a good look at what type of posts are working, providing a baseline for online strategists. It takes a bit of work but it sure beats having a blank spot in your reporting.
Have you played around with Google Ripples, or used it to guide your online strategy? Let us know in the comments — we would love to hear about your experience!